
nSights · Investing in Startups
How Investors Evaluate VC Fund Performance
Learn how LPs evaluate VC funds using MOIC, IRR, TVPI and DPI, plus a real, transparent look at nVentures Fund I’s own numbers.
Quick answer
Investors judge VC fund performance using four metrics together, not one. MOIC shows how many times invested capital has multiplied. IRR shows how quickly that return was generated. TVPI combines cash already returned with the current value of what’s still held. DPI shows how much of that is real cash back in an LP’s pocket. A fund can look strong on one metric and unproven on another, which is why experienced LPs check all four.
Investing in a venture capital fund is very different from investing in a startup. For a first-time investor, the challenge is knowing what to look for: the manager, the portfolio, the fund’s stage, or the headline return number. The answer is all of these, in order. Venture capital takes years to play out, and a fund’s performance looks different at different points in its life, which is why professional investors weigh MOIC, IRR, TVPI and DPI together, not separately.
Why a fund instead of investing directly?
Direct investing can work well if you have the deal access, capital, and time to build a diversified portfolio yourself. A VC fund does that work for you: diversification across many companies, professional portfolio construction, deal access you may not otherwise see, and a manager’s judgement on when to double down. Neither approach is automatically better. The right question is which structure fits you.
How should you evaluate a fund?
Before the return numbers, look at the fund itself.
Who’s managing it? Past investing and operating experience, including failures, matters more than any single return figure. A repeatable process is more useful than one lucky deal.
What’s in the portfolio? Stage, sector, geography, cheque size, and concentration all shape the risk profile. Ten investments and thirty investments carry very different risk.
Then: what has the fund actually returned? This is where four metrics matter.
MOIC (Multiple on Invested Capital) shows how many times capital has multiplied; a 3x MOIC means $1 became $3. It doesn’t show how long that took.
IRR (Internal Rate of Return) factors in timing. A 2x return over three years and a 2x return over eight years produce very different IRRs. Early distributions can make IRR look stronger than the underlying multiple suggests.
TVPI (Total Value to Paid-In Capital) combines cash already distributed with the current estimated value of what’s still held. It’s essential for young funds, but unrealised value is an estimate, not cash in the bank.
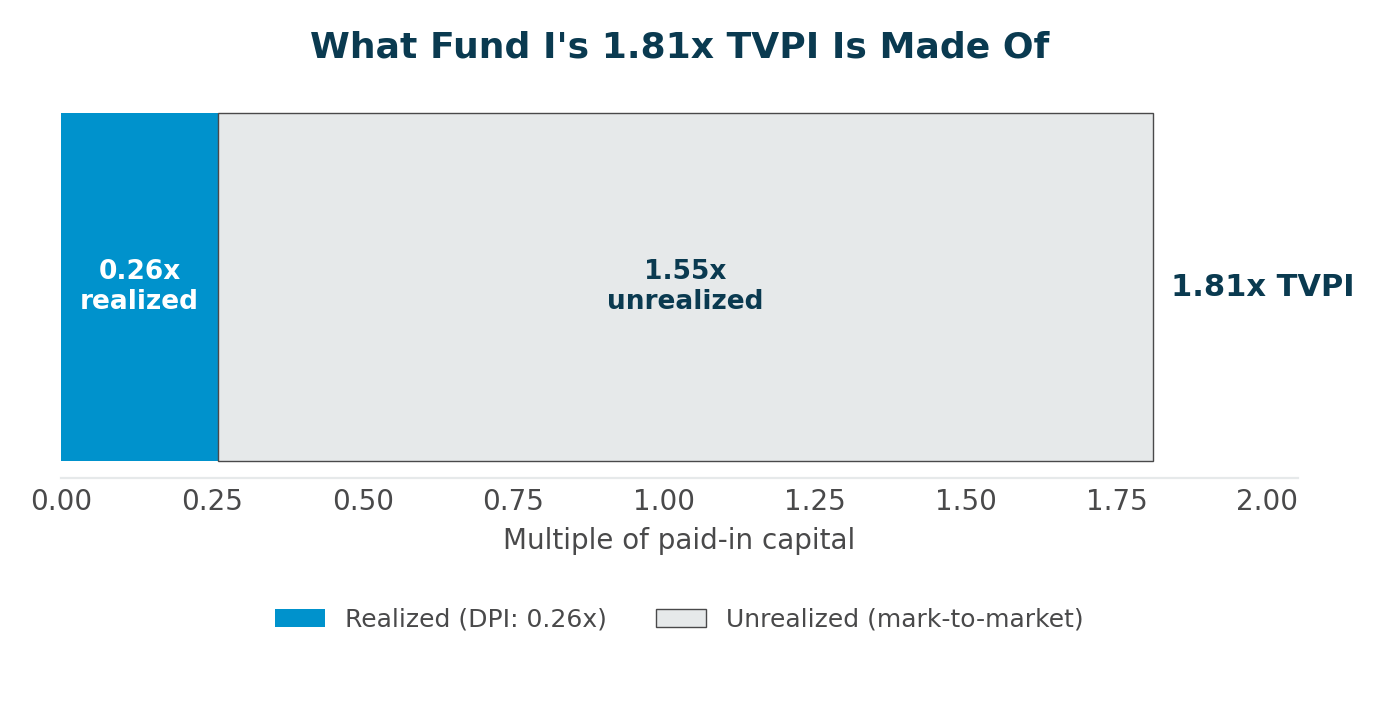
DPI (Distributions to Paid-In Capital) is the cash LPs have actually received. A 0.26x DPI means 26 cents back per dollar invested. Low DPI is normal for a young fund.
| Metric | Tells you | Misses |
|---|---|---|
| MOIC | How many times capital has multiplied. | How long that took. |
| IRR | How efficiently capital was returned over time. | Can look inflated by early distributions. |
| TVPI | Realised value plus current estimated value. | Unrealised portion is a mark, not cash. |
| DPI | Real cash back per dollar invested. | Naturally low in a young fund. |
If you had to focus on one metric, DPI tells you the most about what an LP has actually received back. But DPI alone can understate a younger fund’s progress. That’s why LPs look at DPI alongside TVPI, MOIC and IRR, while also considering the fund’s age and remaining portfolio.
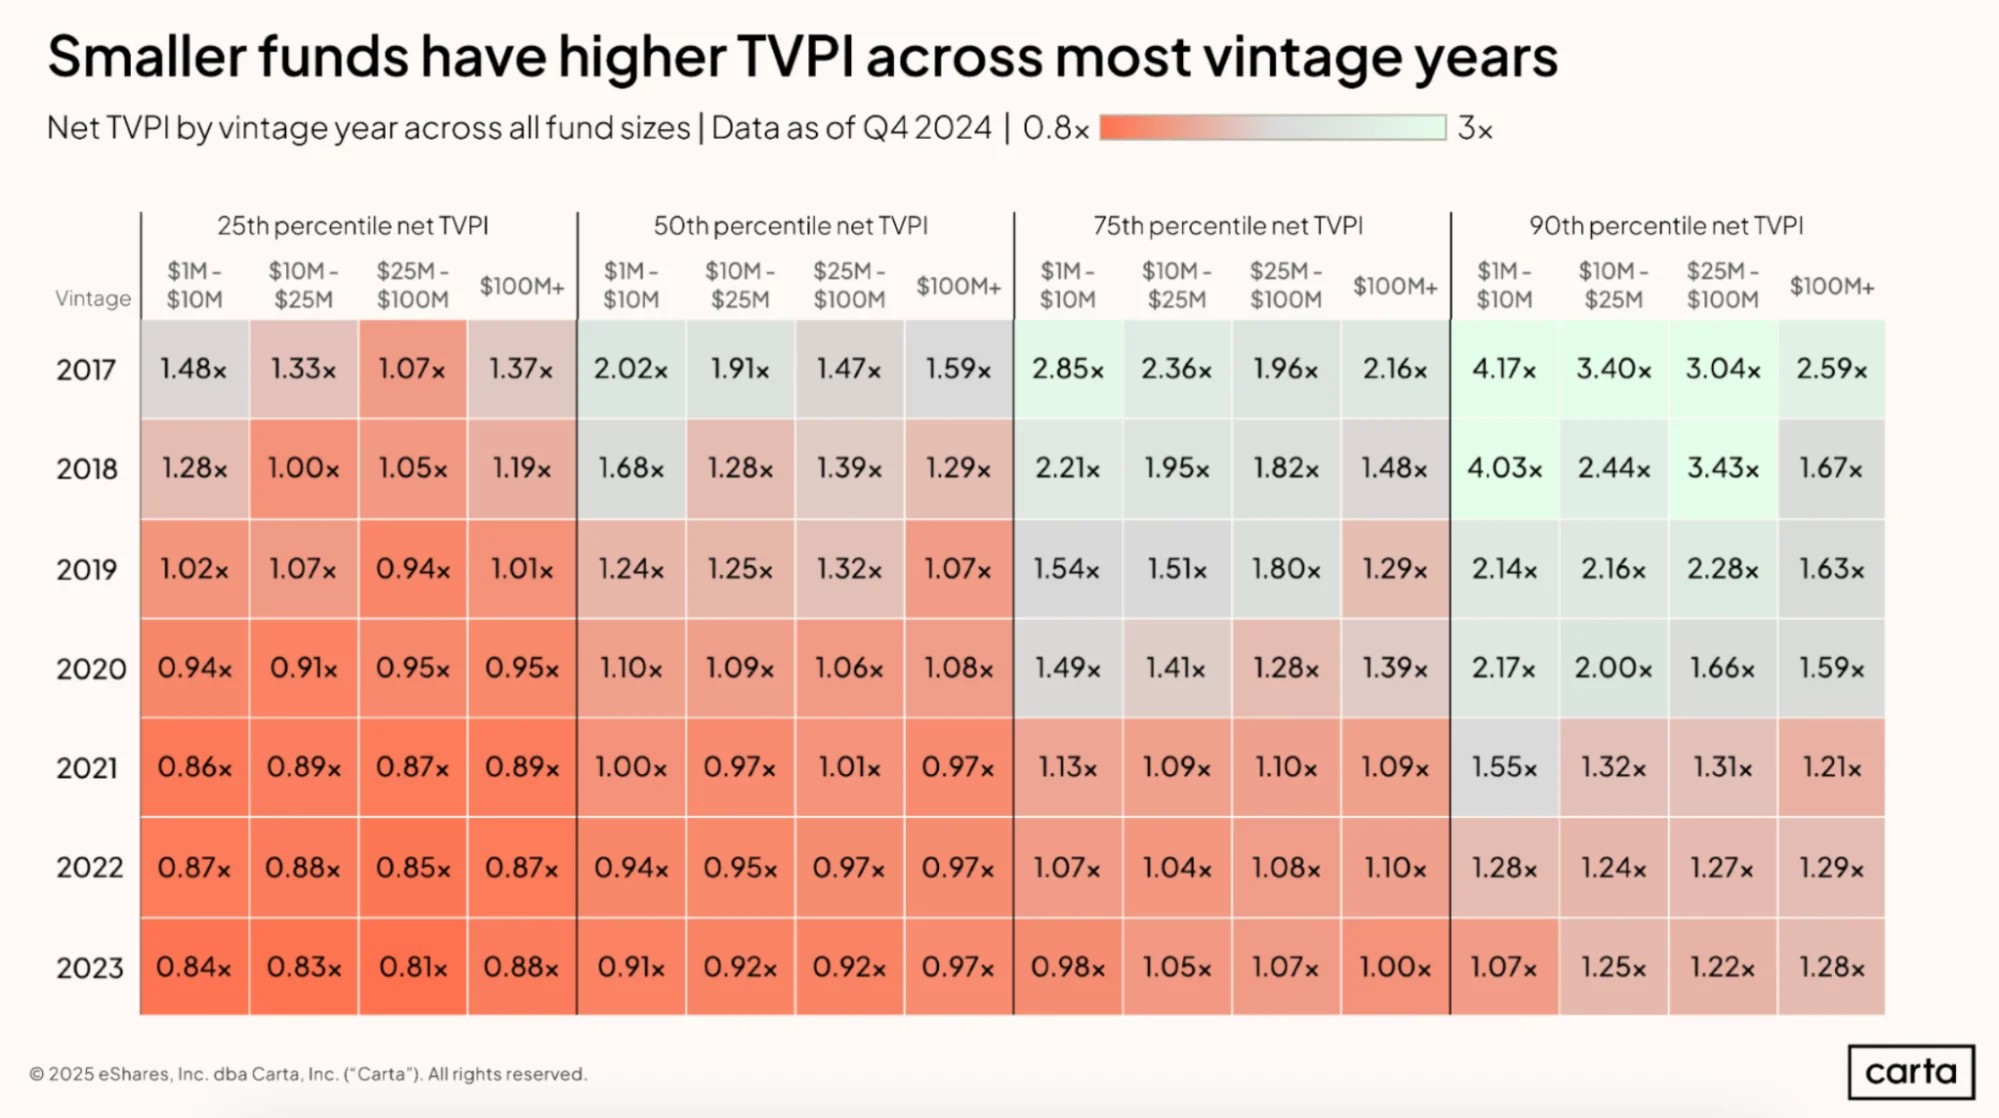
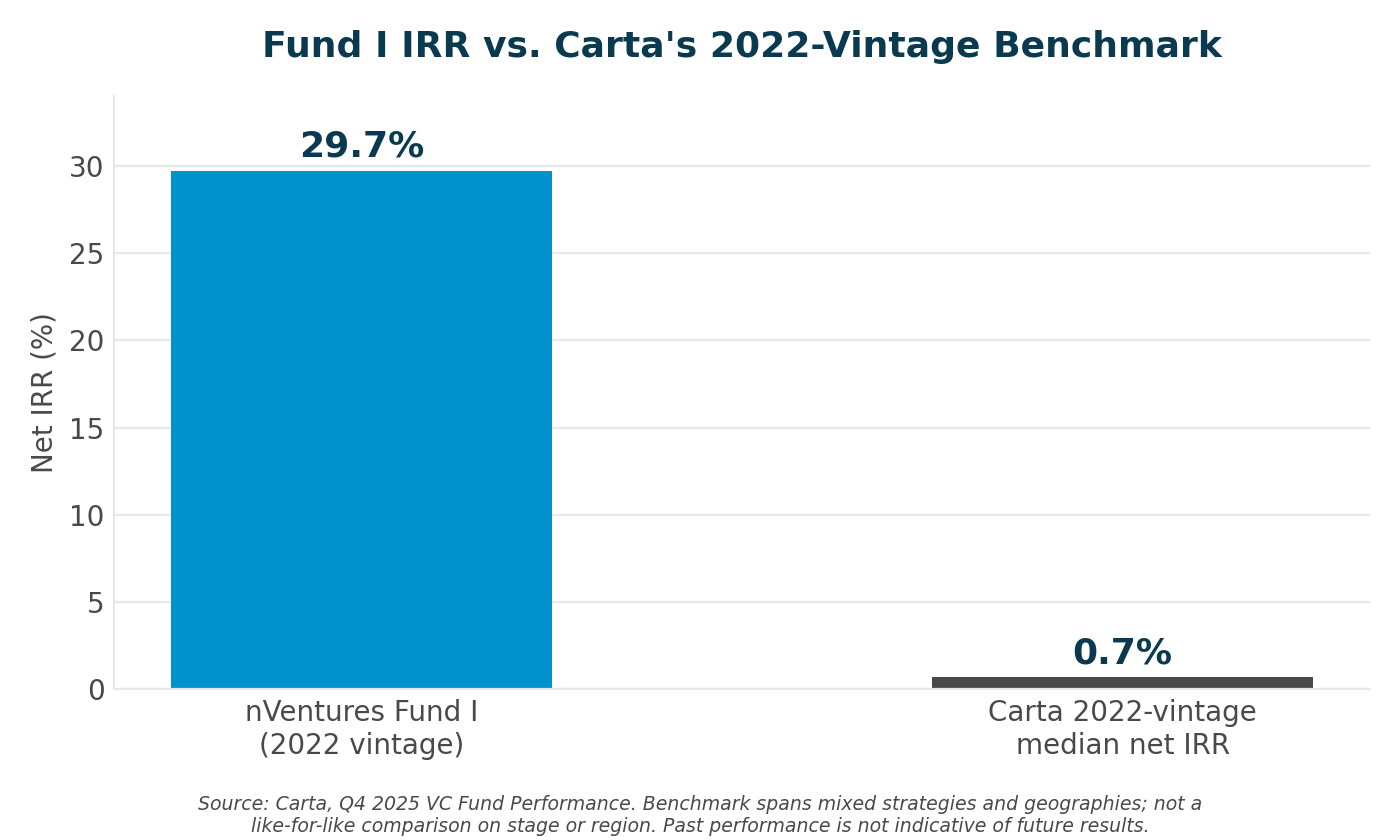
For scale, Carta’s Q4 2025 data puts the median net IRR for 2022-vintage U.S. venture funds at 0.7%. Its Q4 2024 fund-size analysis provides a more relevant comparison for a small fund like ours: among 2022-vintage funds in the $1M-$10M range, the 90th percentile TVPI was 1.28x, and the median was 0.94x.
Fund I’s 1.81x TVPI is above the 90th percentile TVPI of 1.28x for that cohort. Its 29.7% IRR is also well above the 0.7% median IRR for 2022-vintage funds overall. These aren’t perfectly like-for-like comparisons: Carta’s dataset covers U.S. funds, while Fund I invests across South and Southeast Asia.
Most VC funds use a “2 and 20” model: a 2% annual management fee and 20% carried interest on profits, though exact terms vary. The single most important thing to check: are the return figures you’re shown gross or net of fees and carry? Net is what an LP actually receives.
Before investing in any fund, ask:
- Who is the manager, and what have they actually built or invested in?
- What stage, sector, and geography does the fund understand?
- How do MOIC, TVPI, IRR and DPI look together, not alone?
- How much value is realised cash versus a current estimate?
- How concentrated is the portfolio in a handful of companies?
- How are unrealised positions valued, and by whom?
- What are the fees, carry, and the GP’s own commitment?
Applying the same framework to nVentures Fund I
We hold ourselves to the same standard.
Chalinda has spent 15+ years building Sri Lanka’s startup ecosystem, running incubator and accelerator programmes across South and Southeast Asia and sitting on the investment side of 50+ funding decisions for regional funds.
Imal spent years in enterprise tech at IBM and Cisco before founding nCinga Innovations, which scaled across seven countries and was acquired by Sequoia Capital and Temasek-backed Zilingo in 2020.
Ashok, Sanjaya, Martin & Kumar all have built, scaled and exited startups across the globe multiple times. Our detailed profiles can be found here.
Fund I is a 2022-vintage, $2 million fund with 50% of that capital committed by the GP team itself, fully deployed across 13 investments in South and Southeast Asia. As of March 2026:
| Metric | nVentures Fund I |
|---|---|
| Vintage | 2022 |
| Fund size | $2 million |
| GP commitment | 50% |
| Investments | 13 |
| TVPI | 1.81x |
| IRR | 29.7% |
| DPI | 0.26x |
| Institutional exits | 2 |
The gap between 1.81x TVPI and 0.26x DPI matters: Fund I hasn’t returned 1.81x in cash; it has generated 1.81x in total value, of which 0.26x has been distributed so far.
Nine of Fund I’s eleven still-held positions have since raised follow-on rounds from institutional investors at higher valuations, resulting in paper uplifts of roughly 2.5x to 6.4x. These marks are based on subsequent institutional financing rounds rather than internal valuation estimates.
Fund I’s two exits: Kaiju Labs, acquired by Singapore’s KAST Finance at a 48% IRR within 20 months of our first cheque. KAST has since raised $80 million at a $600 million valuation. And WealthOS, a Colombo-built wealth platform, was acquired by JPMorgan Chase & Co. in a deal reportedly worth over $30 million.
What Fund I taught us
Fund I reinforced something we’ve believed from the beginning: small funds can create meaningful returns when the manager has a clear edge in sourcing, selection and supporting companies at the earliest stages. We’re applying that to nVentures Fund II, a fund backing enterprise AI and B2B startups by Sri Lankan founders building for global markets.
If you’re curious about investing in venture capital, or want to learn more about Fund II, reach out; we’d welcome the conversation.
nVentures backs pre-seed and seed-stage B2B fintech and enterprise AI founders, with a focus on Sri Lankan founders building for global markets.
Invest with nVentures